
9 Platforms That Show You a Business Snapshot in One Click
Running a business means juggling dozens of moving parts at once. You need to know where your money is going, how your marketing performs, whether customers are happy, and if your team is on track. The problem is that all this information lives in different places, making it hard to see the big picture without spending hours digging through reports. That’s where snapshot platforms come in. These tools pull together your most important business data and present it in a single view you can check in seconds. Whether you’re a solopreneur or managing a growing team, these platforms help you make faster, smarter decisions without the headache.
- Legiit
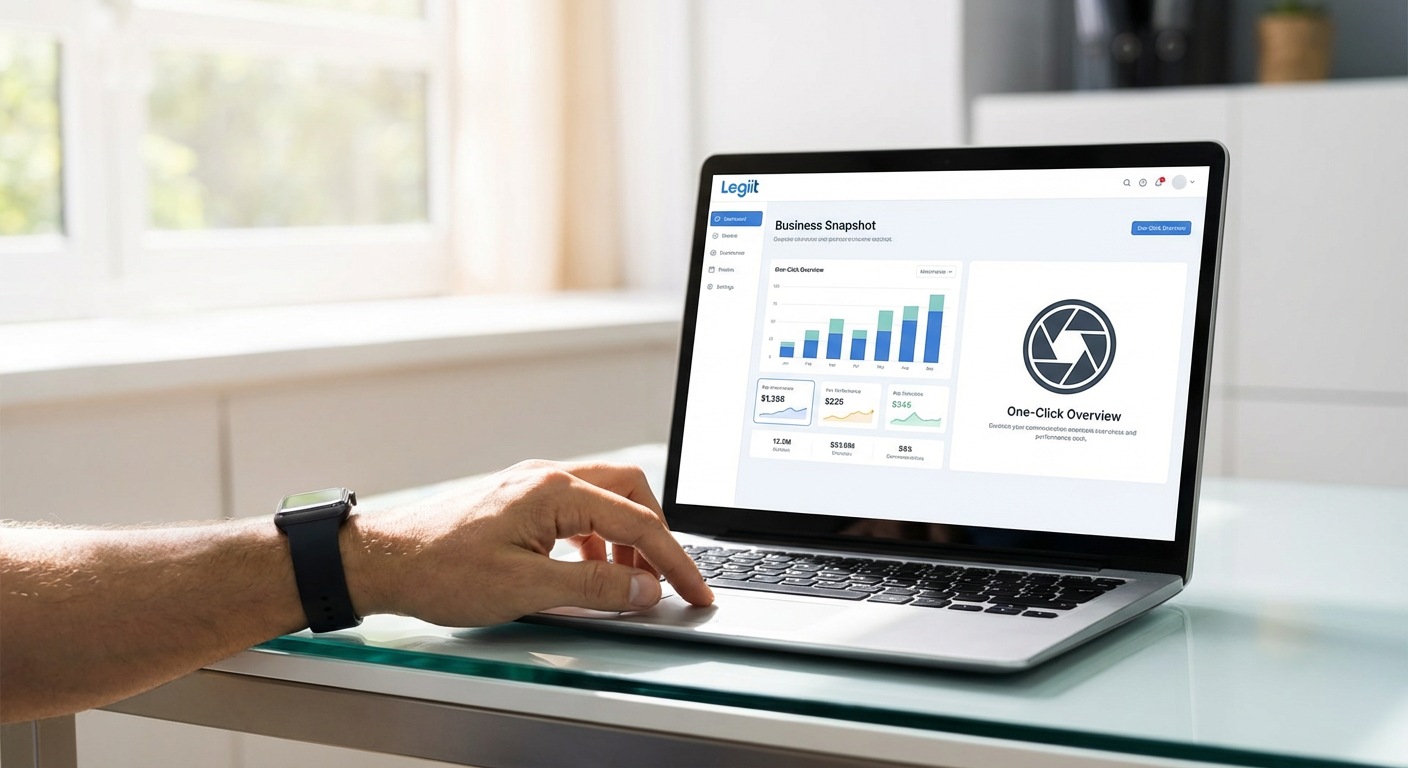
If you run a service-based business or manage freelancers, Legiit gives you a clear view of your project pipeline, active orders, and team performance all in one dashboard. You can see which services are selling, track client communications, and monitor your revenue without clicking through multiple tabs.
The platform is built for people who sell digital services, so everything is organized around getting work done and getting paid. You’ll know exactly where each project stands, which clients need attention, and how much you’ve earned this month. It’s especially useful if you work with multiple freelancers or run an agency, since you can see everyone’s workload and progress at a glance.
What makes Legiit different from generic project management tools is that it’s designed specifically for service providers. You’re not adapting a general tool to fit your needs. Everything from order tracking to client feedback is already set up the way service businesses actually work.
- Salesforce Einstein Analytics
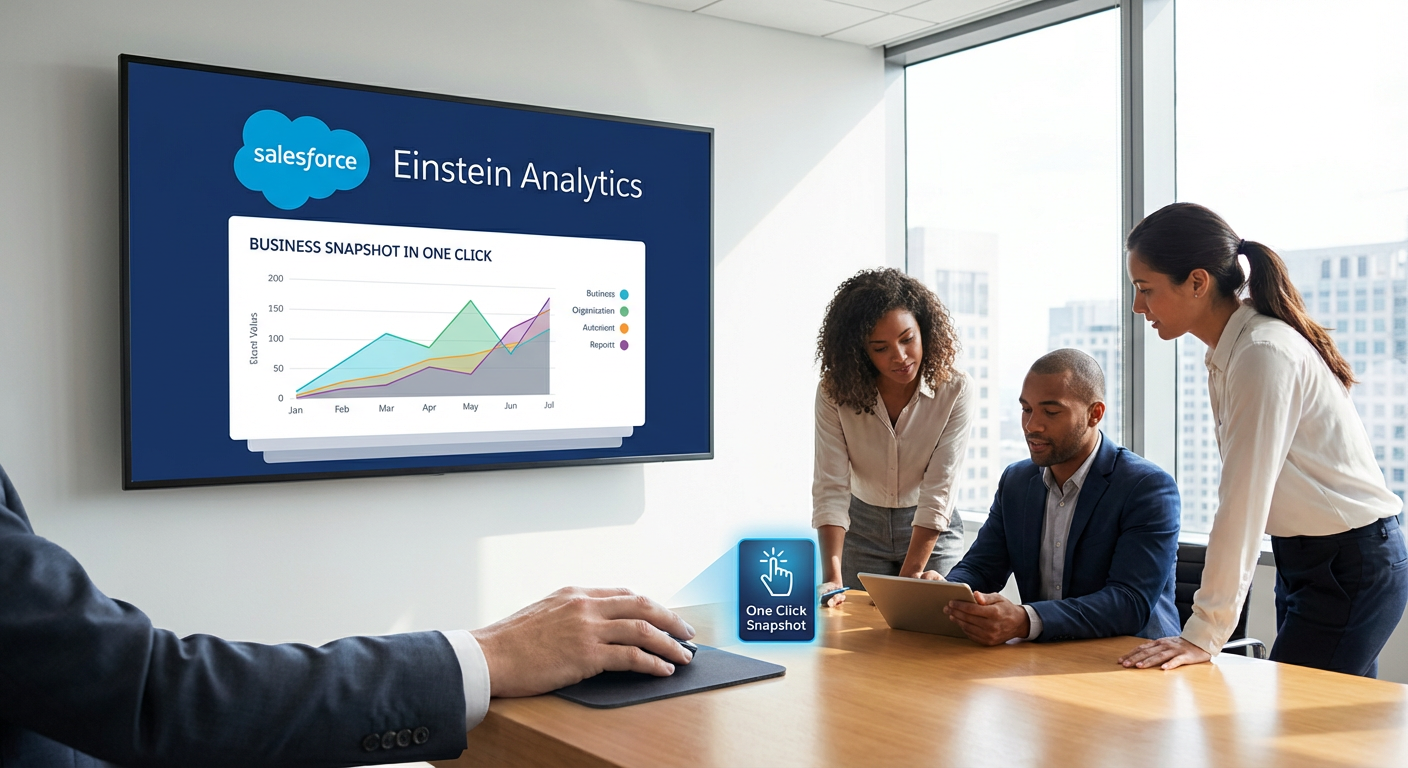
Salesforce has been around for years as a customer relationship management system, but Einstein Analytics takes it further by turning all that customer data into visual snapshots. You can create custom dashboards that show your sales pipeline, customer health scores, and revenue forecasts in real time.
The strength here is how deeply it connects with your existing Salesforce data. If your business already uses Salesforce for sales or customer service, Einstein Analytics can pull everything together without you having to export spreadsheets or manually update reports. You get predictive insights too, like which deals are most likely to close or which customers might churn soon.
This platform works best for businesses that already have a solid amount of customer data flowing through Salesforce. If you’re just starting out or don’t use Salesforce yet, the learning curve and cost might be more than you need.
- Databox
Databox connects to over a hundred different business tools and pulls key metrics into a single dashboard you can customize however you want. You can track website traffic from Google Analytics, ad spending from Facebook, revenue from Stripe, and project progress from Asana all in one place.
The setup is straightforward. You connect the tools you already use, choose which metrics matter most to you, and Databox builds a dashboard that updates automatically. You can also set goals and get alerts when something needs your attention, like when website traffic drops or sales spike.
What people like about Databox is how visual it makes everything. Instead of staring at spreadsheets, you see charts and graphs that make trends obvious. It’s helpful for teams too, since everyone can access the same dashboard and stay on the same page about company performance.
- Geckoboard
Geckoboard is designed for teams that want to display their key business metrics on office TVs or shared screens. It pulls data from your business tools and presents it in clean, readable dashboards that update live throughout the day.
The focus here is simplicity and visibility. Instead of everyone checking different reports on their laptops, the whole team can glance at a shared screen and see how the business is doing. Sales teams can track daily targets, support teams can monitor ticket volumes, and marketing teams can watch campaign performance, all without logging into separate systems.
This platform works particularly well for companies that value transparency and want everyone to feel connected to business goals. The dashboards are built to be understood quickly, so even people who aren’t data experts can make sense of what they’re seeing.
- Klipfolio
Klipfolio gives you the power to build highly customized dashboards that combine data from almost any source. Whether you’re pulling numbers from databases, spreadsheets, APIs, or third-party apps, Klipfolio can bring it all together into visual reports.
The platform offers a library of pre-built dashboard templates for common business needs like marketing analytics, sales tracking, and financial reporting. You can use these templates as starting points and then adjust them to match exactly what you want to see. The flexibility means you can track niche metrics that matter specifically to your business, not just the standard reports everyone else uses.
Klipfolio works well for businesses that have specific reporting needs that generic tools can’t quite handle. If you need to track something unusual or combine data in a particular way, this platform gives you the tools to make it happen.
- Cyfe
Cyfe is an all-in-one business dashboard that connects to marketing, sales, finance, and support tools to give you a complete view of your business. You can monitor everything from social media engagement to inventory levels in a single interface.
One of the nice things about Cyfe is that it includes pre-built widgets for popular services, so you don’t need technical skills to get started. You can have a working dashboard in minutes by simply selecting which widgets you want and connecting your accounts. The platform also lets you create custom widgets if you need to track something specific.
Cyfe is particularly useful for small business owners who wear multiple hats and need to keep an eye on several areas at once. Instead of logging into five different tools every morning, you can check one dashboard and know where everything stands.
- Grow
Grow focuses on making business intelligence accessible to companies that don’t have dedicated data teams. It connects to your business tools, databases, and spreadsheets to create dashboards that show real-time performance across departments.
The platform emphasizes collaboration, allowing teams to share dashboards, add comments, and discuss what the data means. You can set up automated reports that get sent to stakeholders on a schedule, so everyone stays informed without having to remember to check the dashboard.
Grow also includes forecasting features that help you predict future performance based on current trends. This makes it useful not just for seeing where you are now, but for planning where you’re headed. It’s built for growing businesses that need more than basic reporting but don’t want to invest in enterprise-level business intelligence systems.
- Zoho Analytics
Zoho Analytics is part of the larger Zoho suite of business tools, but it works as a standalone analytics platform too. It can pull data from hundreds of sources and turn it into reports and dashboards that are easy to understand.
The strength of Zoho Analytics is how it handles different types of data. You can upload spreadsheets, connect cloud apps, link databases, or even pull data from on-premise systems. Once everything is connected, you can create reports using a drag-and-drop interface that doesn’t require any coding knowledge.
The platform includes AI-powered features that can automatically identify trends and anomalies in your data, pointing out things you might have missed. For businesses already using other Zoho products like Zoho CRM or Zoho Books, the integration is smooth and gives you a unified view of your operations.
- Sisense
Sisense is built for businesses that deal with large amounts of complex data and need powerful analytics without requiring a team of data scientists. It can handle data from multiple sources and turn it into interactive dashboards that anyone in your company can use.
What sets Sisense apart is its ability to process data quickly, even when you’re working with millions of records. This makes it suitable for larger businesses or rapidly growing companies that are outgrowing simpler dashboard tools. The platform also offers embedded analytics, meaning you can integrate these dashboards directly into your own applications or portals.
Sisense includes features for predictive analytics and machine learning, helping you not just see what happened, but understand what might happen next. This makes it valuable for businesses that want to move beyond basic reporting and start using their data to make proactive decisions.
Getting a quick, accurate snapshot of your business shouldn’t require a degree in data science or hours of manual report building. The platforms on this list are designed to save you time and give you clarity when you need it most. Some are better for small teams that need simplicity, while others handle complex data for growing companies. The right choice depends on what kind of business you run, which tools you already use, and how deep you need your analytics to go. Start by identifying your three most important business metrics, then look for the platform that makes tracking those metrics as simple as possible. When you can see your business clearly in seconds instead of hours, you’ll make better decisions and spend more time actually running your company instead of just measuring it.