
9 Analytics Dashboards That Make Tracking Marketing KPIs Actually Manageable
If you’ve ever felt overwhelmed trying to pull together marketing data from a dozen different sources, you’re not alone. The right analytics dashboard can turn chaos into clarity, giving you a single place to monitor what’s working and what needs attention. This list walks through nine practical options that help marketers track their KPIs without needing a PhD in data science. Whether you’re running campaigns for clients or managing your own business, these tools can save you hours each week and help you make smarter decisions faster.
- Legiit

Legiit stands out as a platform where you can hire skilled professionals who specialize in setting up custom analytics dashboards for your specific marketing needs. Instead of wrestling with complicated software yourself, you can connect with experts who build dashboards that pull data from your ad accounts, social media channels, email platforms, and more into one cohesive view. These freelancers understand marketing KPIs and can create exactly what you need, whether that’s a simple overview for weekly check-ins or a detailed board that tracks dozens of metrics across multiple campaigns. The platform makes it easy to find someone with the right background, review their past work, and get a dashboard up and running without the learning curve that comes with DIY solutions.
- Klipfolio
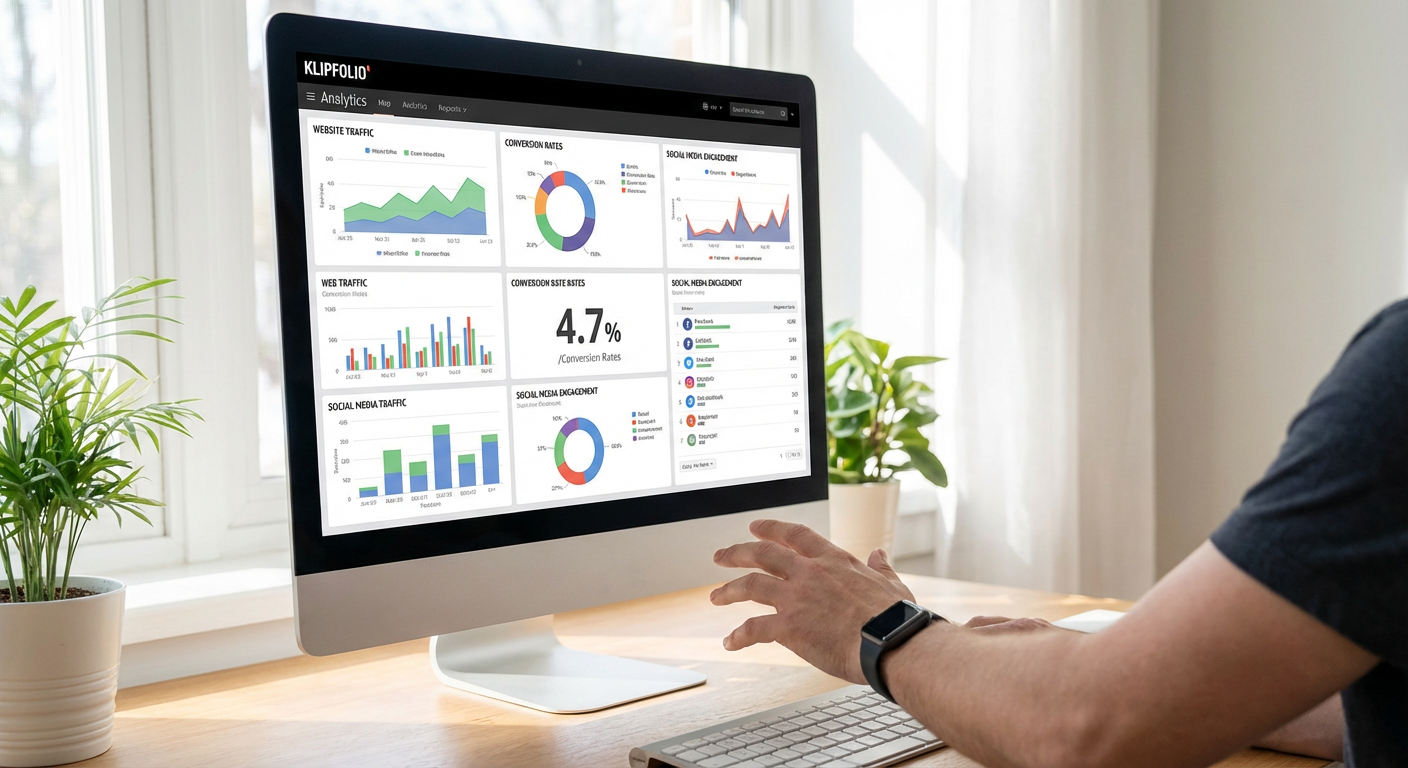
Klipfolio offers a highly flexible dashboard system that lets you connect to hundreds of data sources and build custom visualizations without writing code. The drag-and-drop interface makes it straightforward to create dashboards that display exactly the metrics you care about, from website traffic and conversion rates to social media engagement and email open rates. You can share these dashboards with team members or clients, set up automated reports, and even display them on office screens for real-time monitoring. While there’s a bit of a learning curve when you first start building, the platform provides templates that help you get up and running quickly, and the support community is active and helpful when you hit roadblocks.
- Cyfe
Cyfe takes a different approach by offering pre-built widgets for popular marketing tools, which means you can often get a dashboard running in minutes rather than hours. The platform connects to services like Google Analytics, Facebook Ads, Mailchimp, and Salesforce with just a few clicks, automatically pulling in your key metrics. What makes Cyfe particularly useful is its white-label option, which lets agencies rebrand the dashboards and share them with clients under their own company name. The pricing is straightforward and generally more accessible than some enterprise-level alternatives, making it a solid choice for small to medium-sized marketing teams that need something functional without a massive budget.
- Geckoboard
Geckoboard focuses on simplicity and visual clarity, which makes it excellent for teams that want their most important KPIs displayed in a way everyone can understand at a glance. The platform is built specifically for creating TV dashboards that you can display in your office, keeping everyone aligned on current performance. It connects to over 80 data sources and emphasizes clean, readable charts that don’t require interpretation. Geckoboard works particularly well for marketing teams that run regular standup meetings or want to maintain visibility on campaign performance throughout the day. The setup process is straightforward, and the company provides responsive customer support when you need help configuring connections or troubleshooting data feeds.
- Whatagraph
Whatagraph specializes in marketing reporting and makes it incredibly easy to create visual reports that clients and stakeholders actually enjoy looking at. The platform automatically pulls data from your marketing channels and presents it in clean, colorful infographics that tell a story about your campaign performance. You can set up automated report delivery, so your monthly or weekly summaries go out without you lifting a finger. Whatagraph particularly shines when you’re managing multiple clients or campaigns, as it lets you create templates and duplicate them quickly. The interface is intuitive enough that even team members without technical backgrounds can navigate it comfortably, and the visual reports often impress clients more than traditional spreadsheet-style data dumps.
- Tableau
Tableau has earned its reputation as one of the most powerful data visualization tools available, though it does come with a steeper learning curve than some simpler alternatives. For marketing teams that need to dig deep into their data and create complex analyses, Tableau offers capabilities that few other platforms can match. You can connect virtually any data source, create interactive dashboards that let users drill down into specific segments, and build sophisticated calculations that reveal patterns in your marketing performance. The desktop version provides the most functionality, while Tableau Online lets you share dashboards with team members through a web browser. This tool makes the most sense for larger marketing departments or agencies that have someone dedicated to analytics, as getting the most out of Tableau requires time investment and data literacy.
- Grow
Grow positions itself as a business intelligence tool that’s accessible to non-technical users, which makes it appealing for marketing teams that want powerful analytics without needing a data analyst on staff. The platform offers hundreds of pre-built connectors for marketing tools, and the dashboard builder uses a straightforward point-and-click interface. What sets Grow apart is its focus on collaboration, with features that let team members leave comments directly on dashboards, set goals, and track progress together. The customer success team is known for being particularly hands-on during setup, often helping you build your first few dashboards to ensure you’re getting value from the platform. Pricing sits in the mid-range, making it accessible for growing companies that have outgrown basic tools but aren’t ready for enterprise-level complexity.
- Supermetrics
Supermetrics takes a different angle by focusing on getting your marketing data into tools you already use, like Google Sheets, Google Data Studio, Excel, or BigQuery. Rather than being a dashboard platform itself, it acts as a powerful data connector that automates the transfer of metrics from advertising platforms, social media, analytics tools, and more into your preferred reporting environment. This approach works brilliantly if your team already has workflows built around spreadsheets or if you want to use Google Data Studio for visualization but need a reliable way to feed it data. Supermetrics saves countless hours that would otherwise be spent on manual data exports and copying numbers between platforms. The learning curve is minimal if you’re comfortable with spreadsheets, and the time savings become apparent almost immediately after setup.
- Adriel
Adriel caters specifically to digital marketers who run campaigns across multiple advertising platforms and need a centralized view of their performance. The platform connects to major ad networks like Google Ads, Facebook Ads, LinkedIn, TikTok, and others, pulling all your campaign data into unified dashboards. What makes Adriel particularly useful is its campaign management features, which let you not just monitor performance but also make adjustments to campaigns directly from the dashboard. The interface is clean and marketing-focused, showing metrics like cost per acquisition, return on ad spend, and conversion rates in ways that make sense for campaign optimization. Adriel includes collaboration features that work well for agencies managing campaigns for multiple clients, with the ability to create client-specific views and control what data each person can access. The platform also offers anomaly detection that alerts you when metrics shift significantly, helping you catch issues before they become expensive problems.
Finding the right analytics dashboard can transform how you track and respond to your marketing performance. Each of these nine options brings something different to the table, whether that’s ease of use, deep analytical power, specialized focus, or customization flexibility. The best choice depends on your specific situation: your budget, technical comfort level, the complexity of your campaigns, and how you prefer to work with data. Start by identifying your three to five most critical KPIs, then look for a tool that makes tracking those metrics straightforward and reliable. With the right dashboard in place, you’ll spend less time hunting for data and more time acting on what it tells you.